What do the columns in the "Categories" report correspond to?
In this FAQ we explain the meaning of each of the columns you'll find in the CATEGORIES report. To find out more about how to use the "Categories" report, go to this FAQ (the video is a bit old, so the column labels have changed a bit, but the principle remains the same!).
Name of the shop where the order was placed.
Identifier of the category.
Name of the category.
Quantity of products in this category sold during the selected period.
Please note: a product is only considered to belong to a category if it has this category as its default category.
Discount total excl. VAT (negative value)
Total amount of discounts applied using voucher code(s) (cart rules), on products in this category.
Please note: this column only calculates discounts resulting from voucher codes (cart rules). Discounts due to specific prices are not taken into account here.
Total VAT on discounts (negative value)
Total VAT associated with the total amount of discounts (cart rules), and which will therefore not be collected and paid to the government.
Total amount of products in the category sold over the selected period, excluding VAT.
If a specific price was applied when the order was placed, it is taken into account. In this sum we also take the eco-tax into account, if a product in the category is concerned, excluding VAT.
Sum of the amounts corresponding to the eco-tax, for the relevant products in the category, excluding VAT. As a reminder, this total is already included in the Product total excl. VAT. This column is useful for your eco-tax declaration forms.
Total cost of the products in the category, over the period concerned.
Notes:
- The module allows you to decide whether you want to consider the cost price of the product as it was at the time the order was placed, or whether you want to take the current value of the product's cost price. By default, the cost price is recorded at the time the order is placed, and this is used for the various calculations. If you prefer to use the current cost price, go to the module configuration and uncheck the corresponding option.
- Moreover, when the module retrieves the cost price value, it first looks at the level of the (default) supplier associated with the product (or product combination). If the cost price has been entered at this level, this value will be taken into account; otherwise, the module will look for the cost price value entered in the product's "Pricing" tab.
These are the profits on the category, before taking into account discounts (voucher codes):

These are the profits on the category, taking into account discounts (voucher codes). Unlike net profits calculated on an order (as in the basic and full reports), net profits on a category do not take wrapping costs into account:


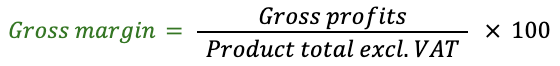
It's a percentage. It is the proportion of gross profits on the category in relation to the total amount of the products of the category:

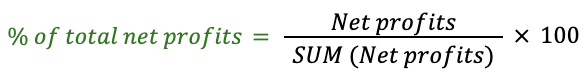
It's a percentage. It is the proportion of net profits on the category in relation to the total amount of the sale of the products of the category:

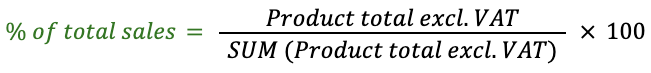
This column shows how much sales of the category's products represent of total sales for the selected period:
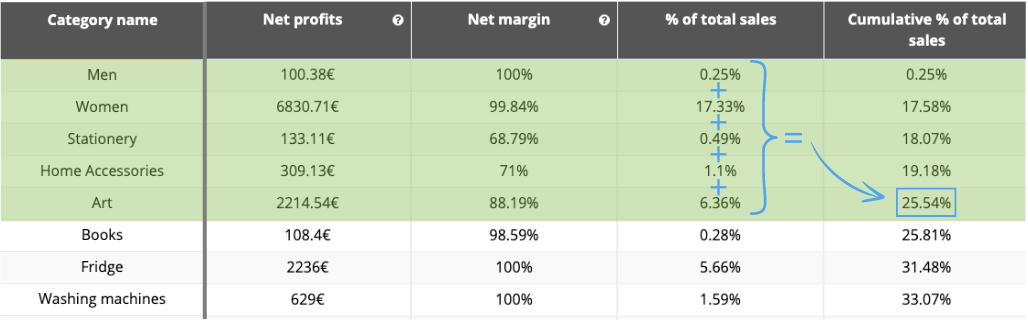
We add up the % of total sales for each category as we go down the column.
Example:
We export a category report and we position ourselves on the "Art" category. If we add up the percentage of total sales for the first 5 categories, we find a cumulative percentage of total sales of 25,54%, which means that the first 5 categories alone account for almost a quarter of total sales for the selected period (25.54%):
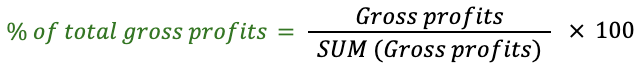
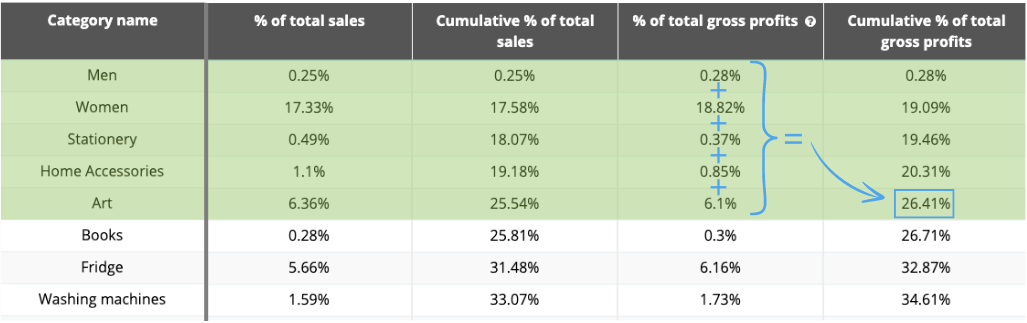
This column shows the proportion of gross profits generated by the category in relation to total gross profits generated over the selected period:
Cumulative % of total gross profits
We add up the % of total gross profits for each category as we go down the column.
Example:
We export a category report and we position ourselves on the "Art" category. If we add up the percentage of total gross profits for the first 5 categories, we find a cumulative percentage of total gross profits of 26,41%, which means that the first 5 categories alone account for just over a quarter of gross profits over the selected period (26.41%):
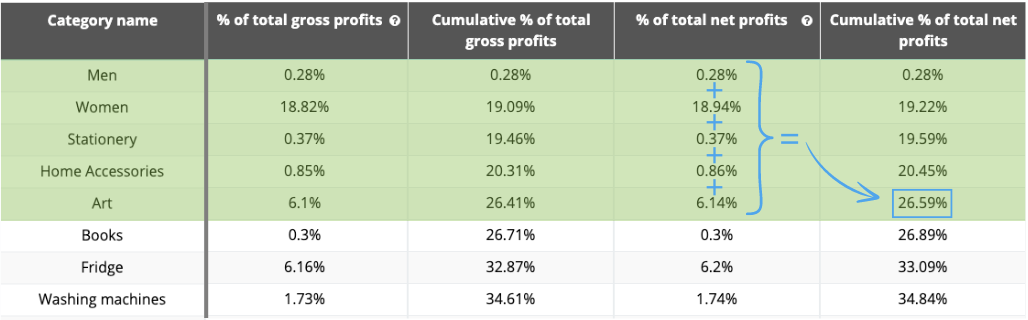
This column shows the proportion of net profits generated by the category in relation to total net profits generated over the selected period:
Cumulative % of total net profits
We add up the % of total net profits for each category as we go down the column.
Example:
We export a category report and we position ourselves on the "Art" category. If we add up the percentage of total net profits for the first 5 categories, we find a cumulative percentage of total net profits of 26,59%, which means that the first 5 categories alone account for just over a quarter of net profits over the selected period (26.59%):
Other FAQs in this category
- How to use the "Customers" report?
- How to use the "Products" and "Categories" reports?
- How to use the "VAT", "Profits and margins" and "Credit notes" reports?
- What do the columns in the "VAT on products" report correspond to?
- How to export the collected amounts by VAT rate?
- What do the columns in the "VAT" report correspond to?
- What do the columns in the "Profits and margins" report correspond to?
- What do the columns in the "Product credit notes by VAT rate" report correspond to?
- What do the columns in the "Shipping credit notes" report correspond to?
- What do the columns in the "Credit notes" report correspond to?
- What do the columns in the "Customers" report correspond to?
- How to use the "Sales by country" report?
- What do the columns in the "Sales by country" report correspond to?
- How to use the "Brands" and "Suppliers" reports?
- What do the columns in the "Suppliers" report correspond to?
- What do the columns in the "Brands" report correspond to?
- What do the columns in the "Products" report correspond to?
- How to use the "Full" and "Basic" reports?
- What do the columns in the "Basic" report correspond to?
- What do the columns in the "Full" report correspond to?